CPT Q. 049: Why is there today so little volcanism associated with seismic tomography’s ‘superplumes’?
Q. 49. Please explain how the 3D seismic tomography mantle map you have been using, shown below, correlates with the distribution of volcanism we observe today. Specifically, the hot mantle plumes do not seem to line up with the major volcanism – i.e., the larger hot superplume is underneath Africa, which has far less volcanism than the ring of fire, but even the hot superplume underneath the Pacific does not appear to correlate with the volcanoes in the ring of fire.
Response: As I have been emphasizing for several years now, the sort of seismic velocity structure displayed in the figure is amazingly close to what one should expect if there has been a recent episode of CPT associated with the Genesis Flood that produced the fossil record at the earth’s surface. Keep in mind most of the structure depicted in the figure is in the lower regions of the lower mantle. Although oceanic plates at the surface are sheet-like, by the time this material reaches the base of the mantle it becomes blob-like. This blob-like character of the cold material at the base of the mantle is evident in the figures from the 3D calculations I described in my 1994 and 2003 ICC (pdf) papers and included my 2008 ICC PowerPoint presentation.
Although the plate motion history of the Paleozoic, corresponding to the earlier portion of the Flood cataclysm, is poorly constrained, particularly because of the lack of any modern ocean floor from that segment of geological history, the post-Paleozoic plate motion history is reasonably certain. When one applies that later, reasonably well-known plate history with its implied subduction zone locations, one gets a distribution of cold material in the lower mantle that correlates strikingly well with the blue regions in the figure shown above.1
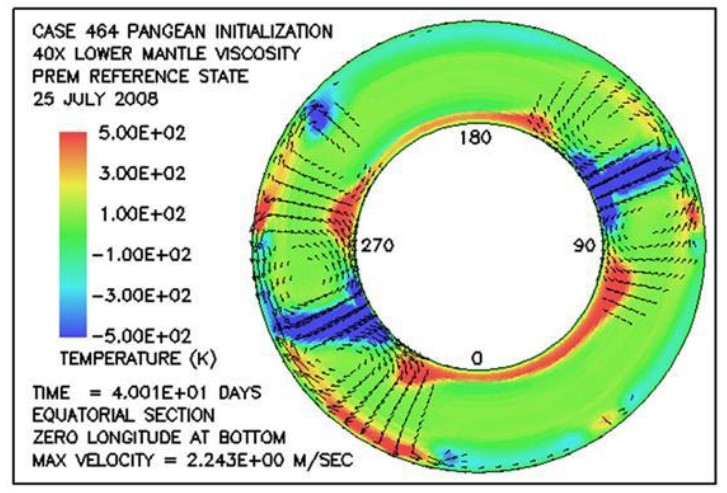
My own calculations yield a similar result. The case I highlighted in my 2008 ICC presentation (pdf), at a time of 40 days into the run, yields the following temperature field in a cross-sectional view through the equator:
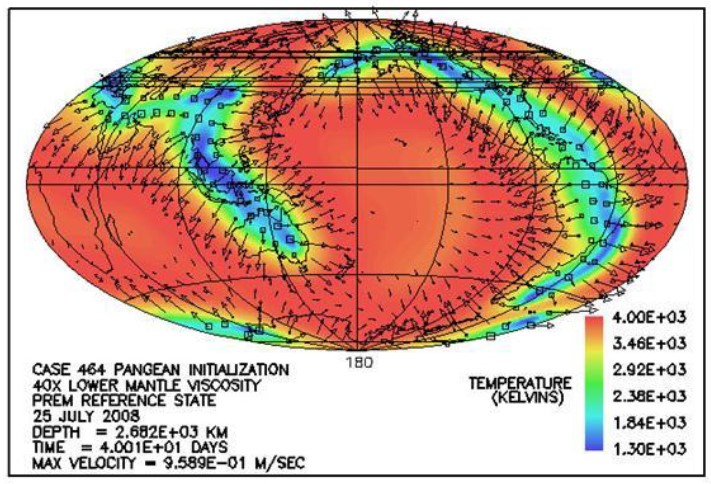
The following plot is a plot of absolute temperature for the spherical surface about 200 km above the bottom of the mantle centered at 180° longitude:

This temperature distribution, of course, represents a single snapshot in time. At later times the cold material displayed in the cross-sectional view, shown in blue, settles and spreads to cover more of the bottom boundary of the mantle. The rock at the base of the mantle which this cold rock displaces, of course, is much hotter. It is not difficult to imagine how, when most of the more rapid motions have ceased, the resulting temperature distribution would resemble that implied by seismic tomography methods for today’s earth.
Hopefully, this brief explanation helps to clarify that the blue features in the seismic tomography image are located, from a depth standpoint, in the lower part of the lower mantle, and from a lateral standpoint generally beneath the margins of the Pangean supercontinent. This means these features are somewhat displaced from the locations of the subduction zones on earth today. The red features, beneath Africa and the south central Pacific, indeed are not associated with that much active volcanism presently. However, the huge number of extinct volcanic seamounts which cover so much of the floor of the Pacific basin does suggest that this large hot feature beneath the central Pacific did cause significant melting and widespread volcanic activity in that region during the Flood.
By contrast, the ring of fire volcanism, closely associated with active subduction around the perimeter of the Pacific, is understood by almost all earth scientists, including most creationist earth scientists, as the result of water and sediments carried down into the mantle by the subduction process. Water significantly reduces rock melting temperatures, and when introduced into the setting of the asthenosphere where rock is already close to its melting temperature, it can and does result in substantial partial melting of the mantle rock and consequent ring of fire volcanism. Understood in this way, it is then plausible why the ring of fire volcanism is associated with currently active subduction zones and also with the blue features in the seismic tomography image if indeed these features represent cold rock subducted during the Flood.
Let me conclude with a question. Since the pre-Flood ocean lithosphere all seems to missing from the earth’s surface today, where else might it be except at the bottom of the mantle? To me at least, as I have emphasized many times in the past, the discovery by modern seismology of this ring-like distribution of high seismic velocity and presumably low-temperature material at the base of the mantle represents exciting and awesome support for the dramatic tectonic catastrophism associated with the Genesis Flood.
-
See, for example, Bunge, H.-P., C. R. Hagelberg, and B. J. Travis (2003), “Mantle circulation models with variational data assimilation: inferring past mantle flow and structure from plate motion histories and seismic tomography,” Geophys. J. Int., 152(2), 280-301. ↩︎