CPT Q. 024: Did the continents separate only once or more than once during the Flood?
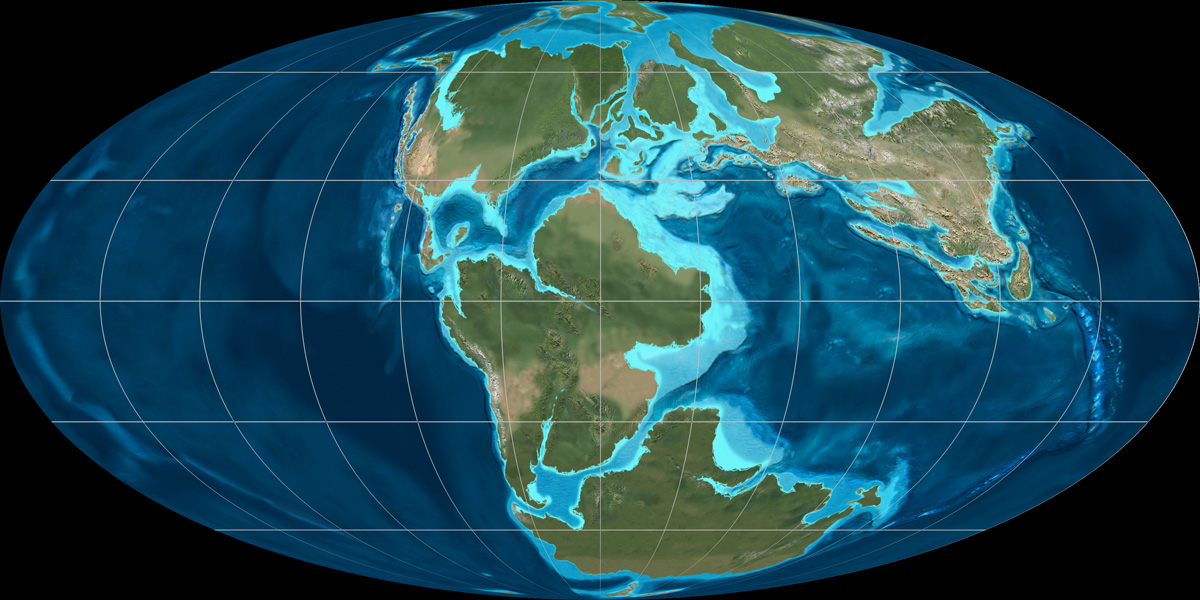
Table of Contents
Q. 24. Did the continents separate only once or more than once? Were the water jets at the mid-ocean ridge something that only happened once at the beginning of the Flood? Does your model assume that the subducting plates all started their movement at the same time? Is there evidence to support this?
Supercontinent breakup
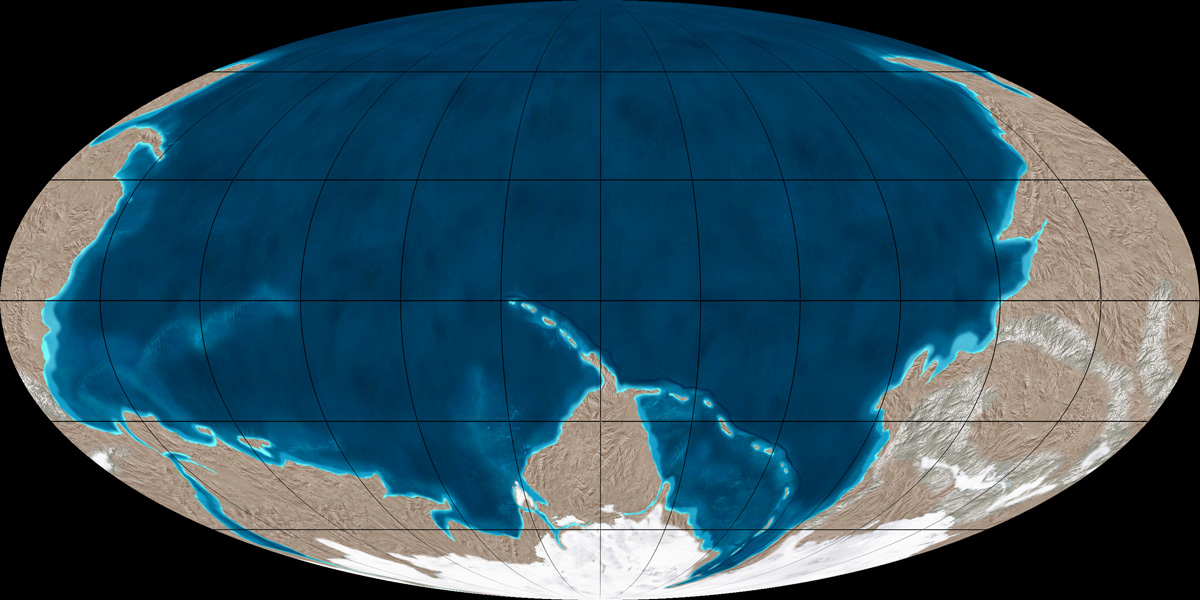
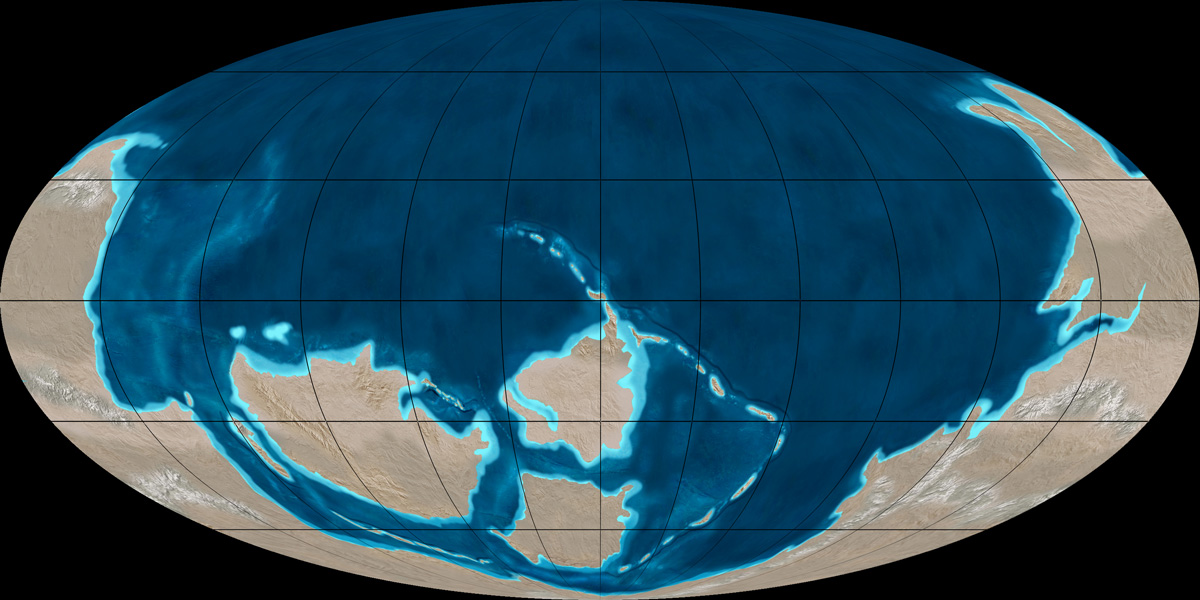
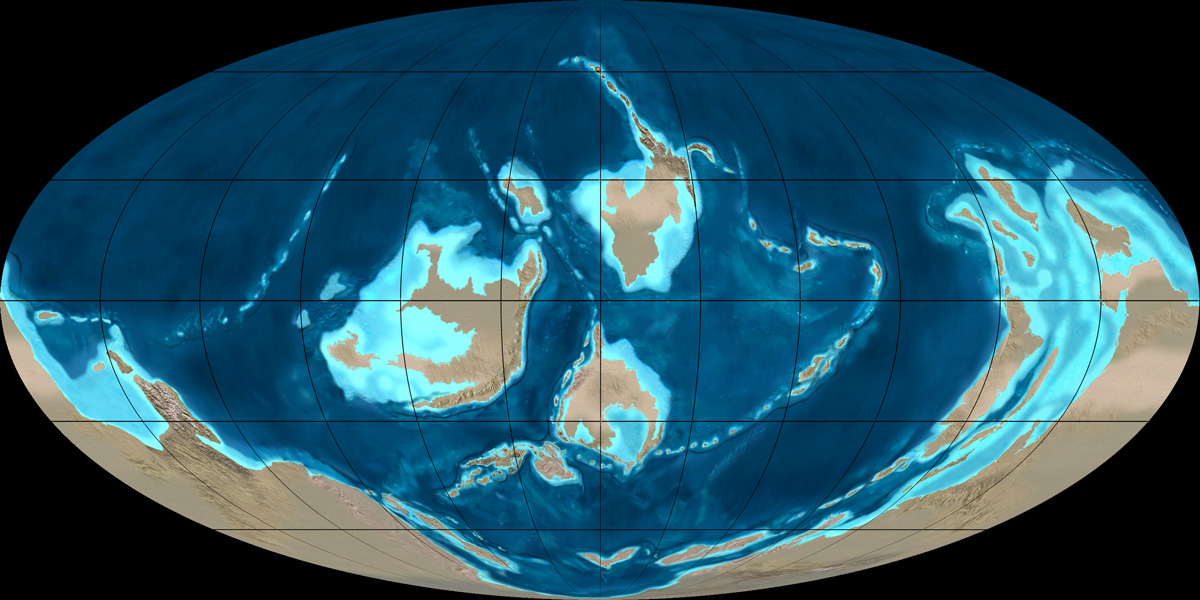
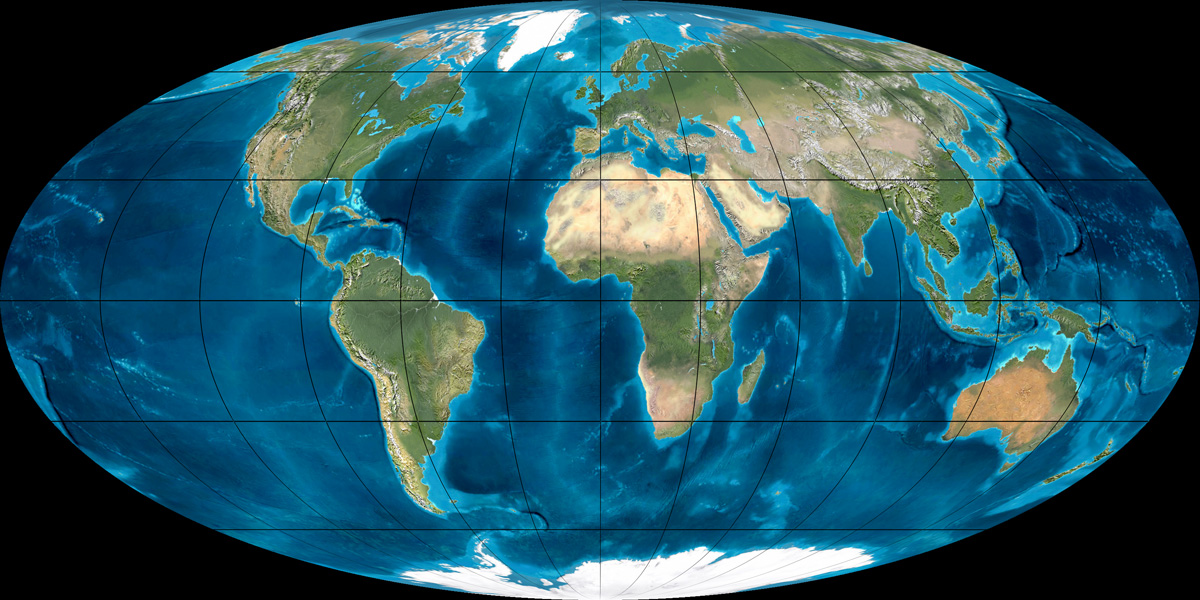
Response: How many times the continents experienced separation depends on which portion of the original supercontinent configuration one considers. The available evidence seems to indicate strongly that the Gondwana portion—involving present-day South America, Africa, Antarctica, India, and Australia—remained intact from the beginning of the Flood cataclysm through the entire part of the geological record known as the Paleozoic and then experienced a single breakup during Mesozoic part of earth history. By contrast, the evidence also strongly suggests that the rest of today’s continents, that is, North America and Eurasia, while apparently joined to Gondwana at the very beginning of the Flood to form a giant supercontinent known as Pannotia, soon afterward broke away from Gondwana as the three separate blocks of Laurentia, Baltica, and Siberia. During the middle and later parts of the Paleozoic, these three blocks came together again and rejoined Gondwana to form the supercontinent Pangea, which then split apart during the Mesozoic. Therefore, the northern continents have experienced two separations. The following images provide one of the best visualizations in my opinion of this history of the continental motions from the time of Pannotia to the present. The images can be freely downloaded from the web here. This is the website of Ron Blakey, emeritus professor of geology at Northern Arizona University.
The following twelve images (out of a total of 27 available on the website [ed. but note above, that the links are now defunct]) depict this history of continental movement. These images by Blakey agree closely with the reconstructions produced by Chris Scotese over the past twenty years as part of the Paleomap Project. These reconstructions are viewed favorably by most of the secular earth science community. The website for the Paleomap Project is http://www.scotese.com. The reliability of these reconstructions in my opinion is reasonably good from the middle Mesozoic (i.e., Jurassic) to the present, mainly because of the constraints provided by features such as fracture zones in today’s ocean floor.
However, for the history earlier than Mesozoic, no seafloor still remains at the earth’s surface. Therefore, the reconstructions must rely on clues from continental rocks, such as the presence of earlier mountain belts, other evidences of earlier tectonic deformations, and paleomagnetic directions locked into igneous rocks and certain sediments. I personally consider the tectonic indicators much more reliable than the paleomagnetic ones. I therefore consider the motions of the continental blocks relative to one another as reasonably reliable for this earlier portion of earth history, as opposed to the absolute locations, because the relative motions rely more on the geological field observations and less on the paleomagnetic interpretations.
The numbers in parentheses in the captions of the figures below represent the uniformitarian age in millions of years. Of course, my conviction is that all the change that unfolded in this sequence, except for a little between the final two frames, occurred within the span of the year of the Flood as described in Genesis 7-8.
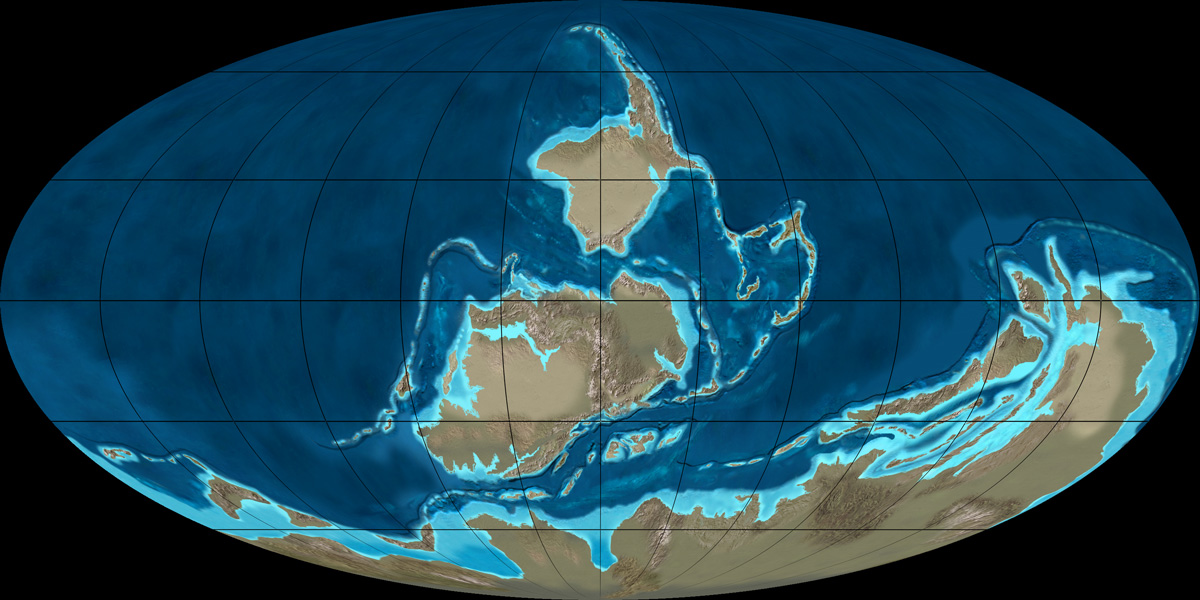
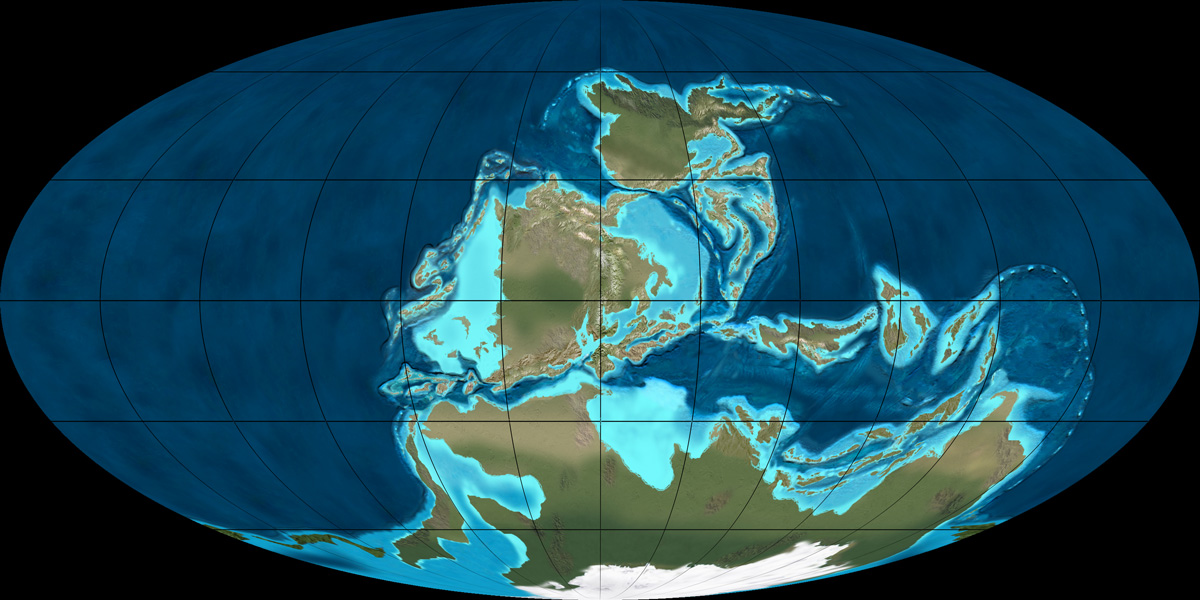
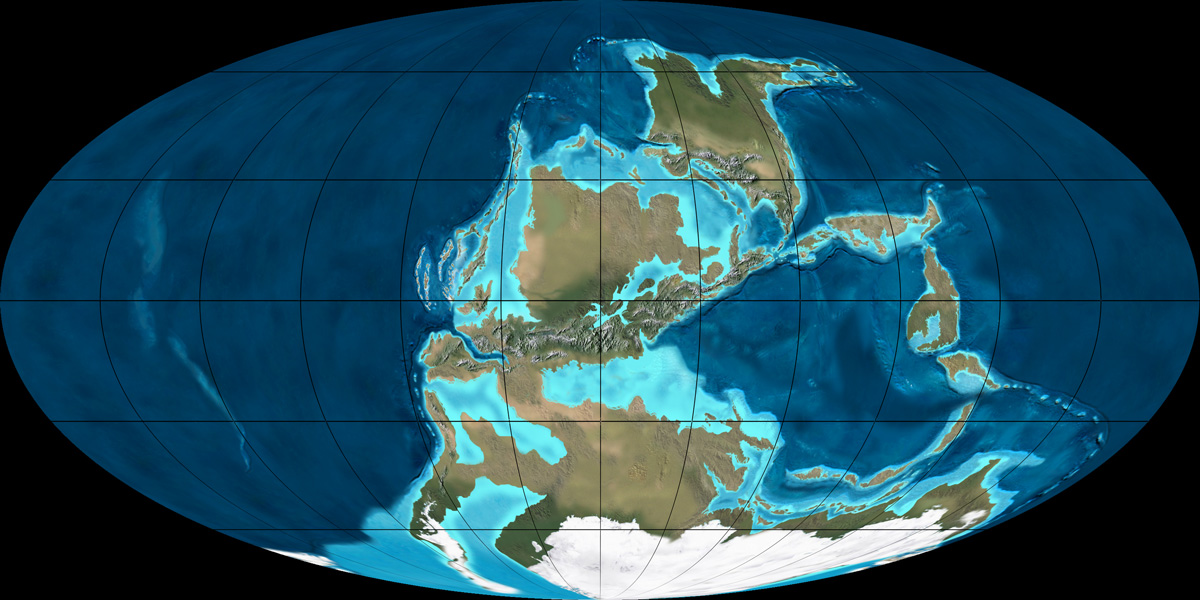
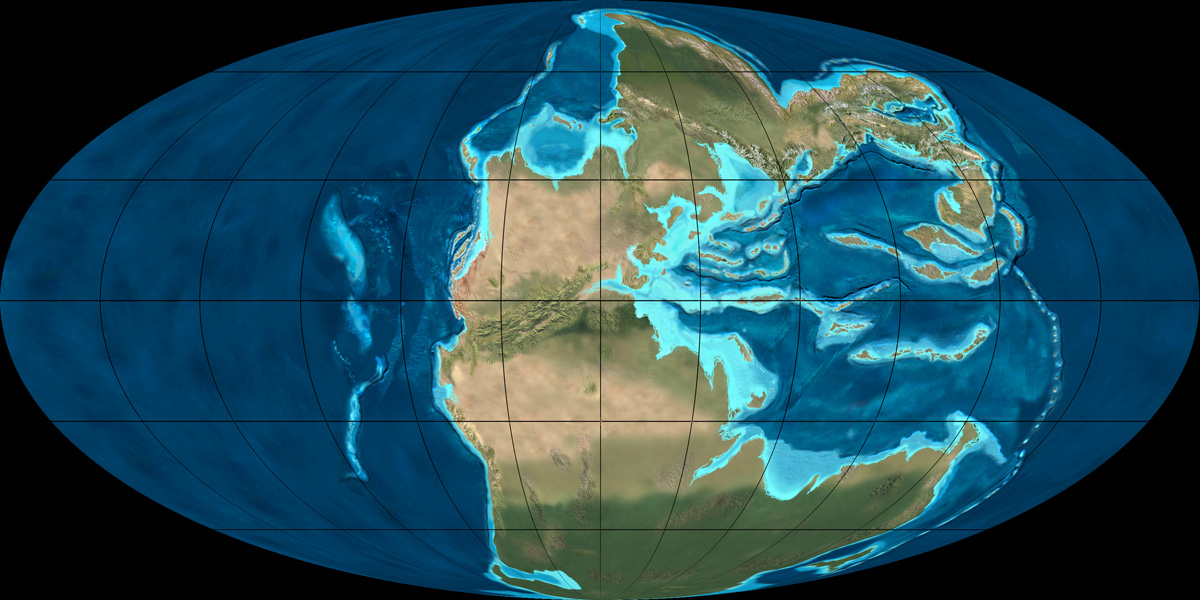
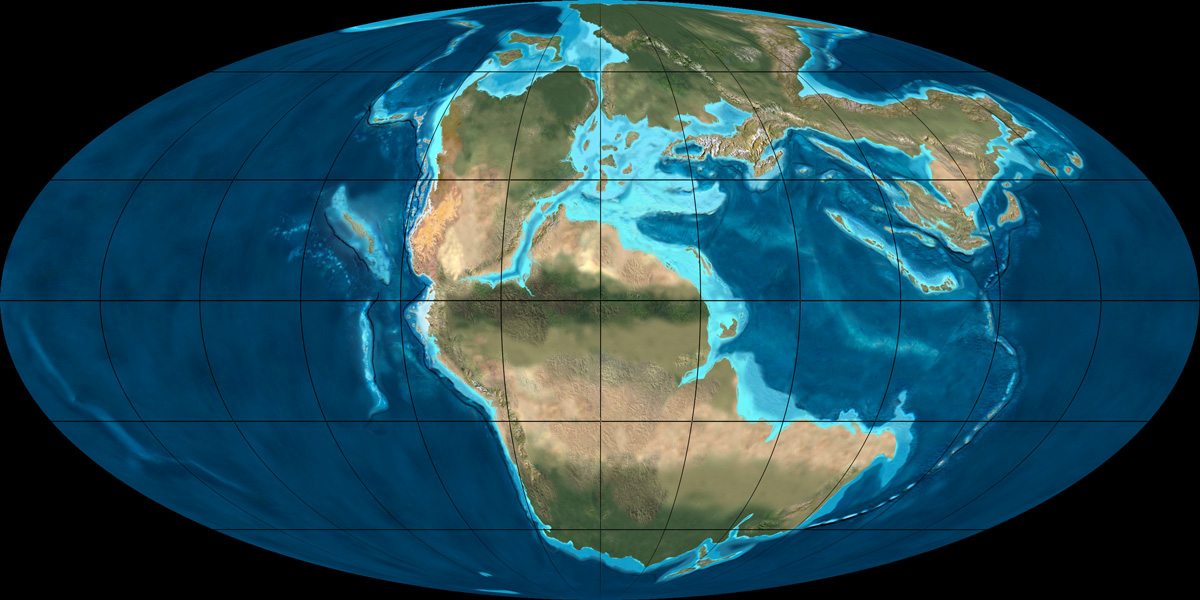

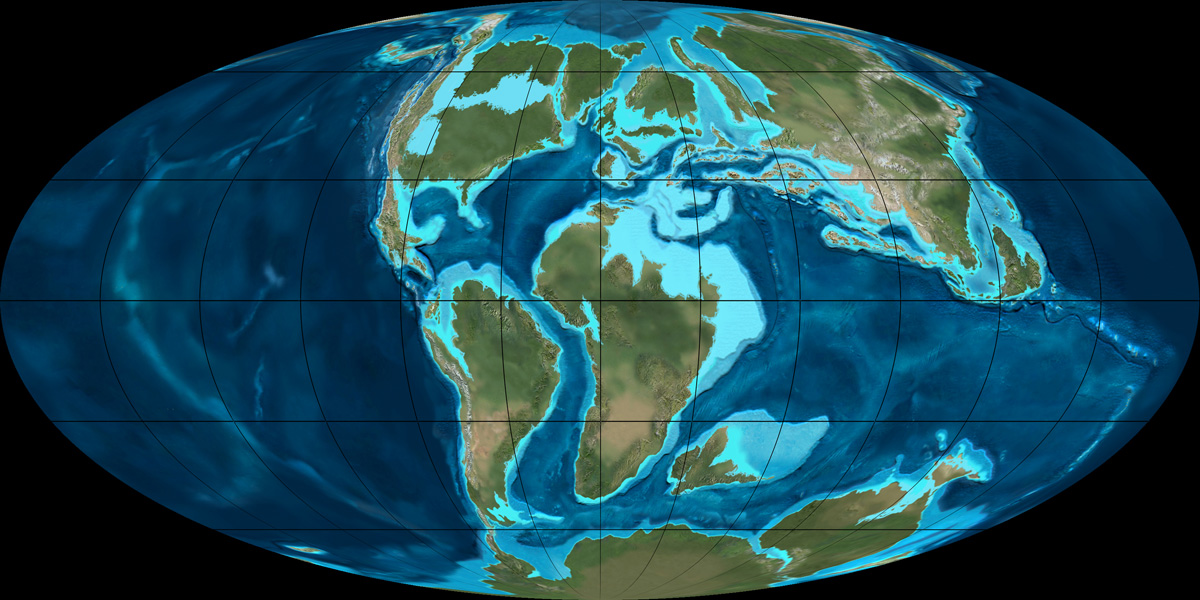
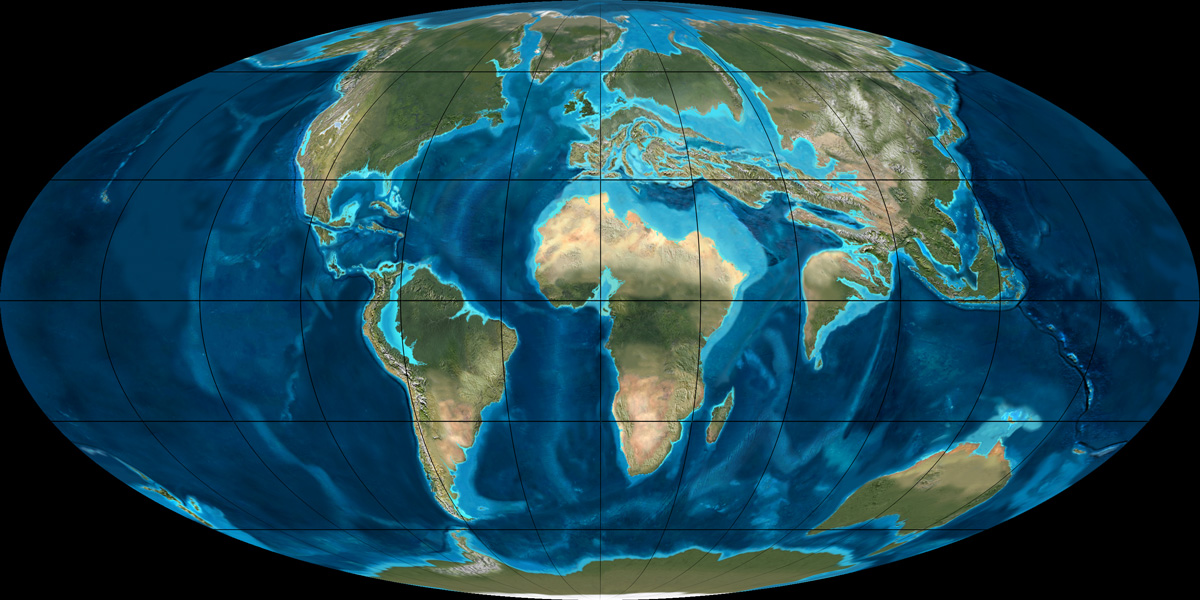
Note that one prominent aspect of these reconstructions is that the Pannotia supercontinent at the beginning of the sequence is centered approximately at the earth’s South Pole, while the supercontinent Pangea that is in place at the beginning of the Mesozoic is centered approximately on the equator. It was in 2006, while I was grappling with just how such a 90° of true polar wander might occur within the short time scale of the Flood for all the continental regions, that I discovered the potential for rotational instability. My own view now is that if such an episode of rotational instability did in fact take place during the Flood, as I am now convinced it did, then the paleomagnetic data that are used to locate Pannotia at the South Pole may simply reflect the fact that the extra rotation that occurred about the axis perpendicular to the spin axis took the supercontinent through the South Pole location multiple times and gave rise to the particular paleomagnetic alignments that are being relied upon. Therefore, my present suspicion is that at the onset of the Flood, Pannotia’s center was near to the equator, and that the placement of the continental blocks within it was strikingly similar to the distribution of blocks which characterized Pangea. In particular, the Gondwanaland block would have been close to identical in its makeup, location, and orientation on the earth relative to its spin axis in both Pannotia and Pangea. If this suspicion is correct, then the continent distribution in figures (a) through (g) should actually be rotated counterclockwise such that the center of mass of the continents lies near the equator throughout the entire sequence. Also, if this suspicion is correct, none of the glaciation depicted for Pannotia or during Mississippian or Pennsylvanian times would have existed.
Flood mid-ocean ridge steam jets
Now let me address the issue of the timing of the steam jets at the mid-ocean ridges relative to this plate motion history. First let me emphasize that for plates to be able to move fast enough for these motions to occur during the time span given in Scripture, runaway motion within the mantle must be occurring to produce the stress-weakening required to reduce the viscosity throughout the mantle by many orders of magnitude. Otherwise mantle rock would display the sorts of viscosities it does today with the result that plate velocities would be on the order of only cm/yr instead of m/s. This leads me to infer that essentially all the plate motion history depicted in the figures above, at least through frame (j), occurred during the main runaway phase of the cataclysm. This main runaway phase would have been accompanied by very rapid seafloor spreading, a curtain of violent supersonic steam jets emerging from the zones of spreading, and consequent heavy rain resulting from water entrained by the jets. The time interval for this main runaway phase would therefore seem to correspond to the forty days and nights of heavy rain described in Genesis 7.
Did the plates all start subducting at the same time?
What about the issue of whether all the subduction began at the same time? My guess is that the answer is no. First of all, let me point out that guessing the initial state for the mantle which is required to yield the sort of plate motion history described above is an extremely difficult, if not impossible, problem. However, in papers I have presented over the years I have shown that a ring of cold material around much of the perimeter of a Pangean-like supercontinent can indeed lead to a subsequent post-Pangean plate motion history similar to that depicted in the above figures. In the model calculations new zones of rapid subduction grow and develop during the course of the calculation. But what about the Paleozoic or pre-Pangean plate motion history that is depicted in these reconstructions? It is my suspicion that the breakaway of the Laurentia, Baltica, and Siberia blocks from Pannotia was likely caused by a runaway upwelling plume of hot material from the bottom of the mantle similar to that observed on the right-hand edge of the 2D calculation that I discuss in the following question (Q25). This first pulse of upwelling would then plausibly be followed by runaway sinking of a cold ring of material as I have included in earlier modeling. This sinking and the associated subduction, however, may have begun earlier in some places than in others. There is nothing in this overall picture that requires the cataclysm to be unfolding at full speed everywhere from the very beginning.
CPT has nothing to do with computer models!
Finally, let me take this opportunity to emphasize that CPT, both as a concept and as a model for the Flood, is grounded in the compelling observational evidence that seafloor spreading and subduction are real processes which not only are occurring today but have also occurred on a massive scale in the past to generate today’s ocean floor basement rocks. As a concept and Flood model, CPT in addition relies on many lines of observational evidence that a huge amount of subduction and seafloor spreading occurred simultaneous with the formation of the fossil-bearing sedimentary record and therefore logically must have played a major part in the cataclysm. Understood in these terms, CPT has nothing to do with computer models! Computer modeling is merely an auxiliary tool to gain deeper insight into the physics and processes involved. The validity of CPT therefore should be judged primarily on the strength and consistency of the observational data and how well this body of data agrees with the constraints of the Biblical text and not on the degree to which the processes can be simulated on a computer.